Drafty
FPL Draft League Analytics
Overview
Drafty is a live analytics dashboard for my FPL (Fantasy Premier League) draft league. It tracks bracket standings, league position over time, transfer history, and bench efficiency across the 2024/25 season. What started as a Christmas break project to answer "why am I so bad at this" evolved into a full-featured analytics tool that refreshes automatically each gameweek.
Originally built with Streamlit, the frontend was rebuilt as a Next.js static site with D3.js visualisations and a Deep Ocean theme.
How It Works
The app is split into two parts: a Python data pipeline and a React frontend.
Data pipeline — A three-stage Python pipeline fetches raw data from the FPL Draft API, cleans and normalises it into DuckDB tables, then runs SQL transforms to produce analytics tables (bracket standings, bench efficiency, transfer blunders, cumulative points). DuckDB was chosen over a traditional database for its columnar storage and ability to run analytical queries efficiently — no hosted database needed, just a single .db file.
Frontend — A Next.js static export renders the data using D3.js charts and Tailwind CSS. The site loads CSV files at runtime, keeping the build simple and the deployment cost-free on Vercel.
Automation — A GitHub Actions cron job runs every Tuesday at midnight UTC, re-fetches all gameweek data from the API, commits the updated database and CSVs, and triggers a Vercel redeploy.
Dashboard
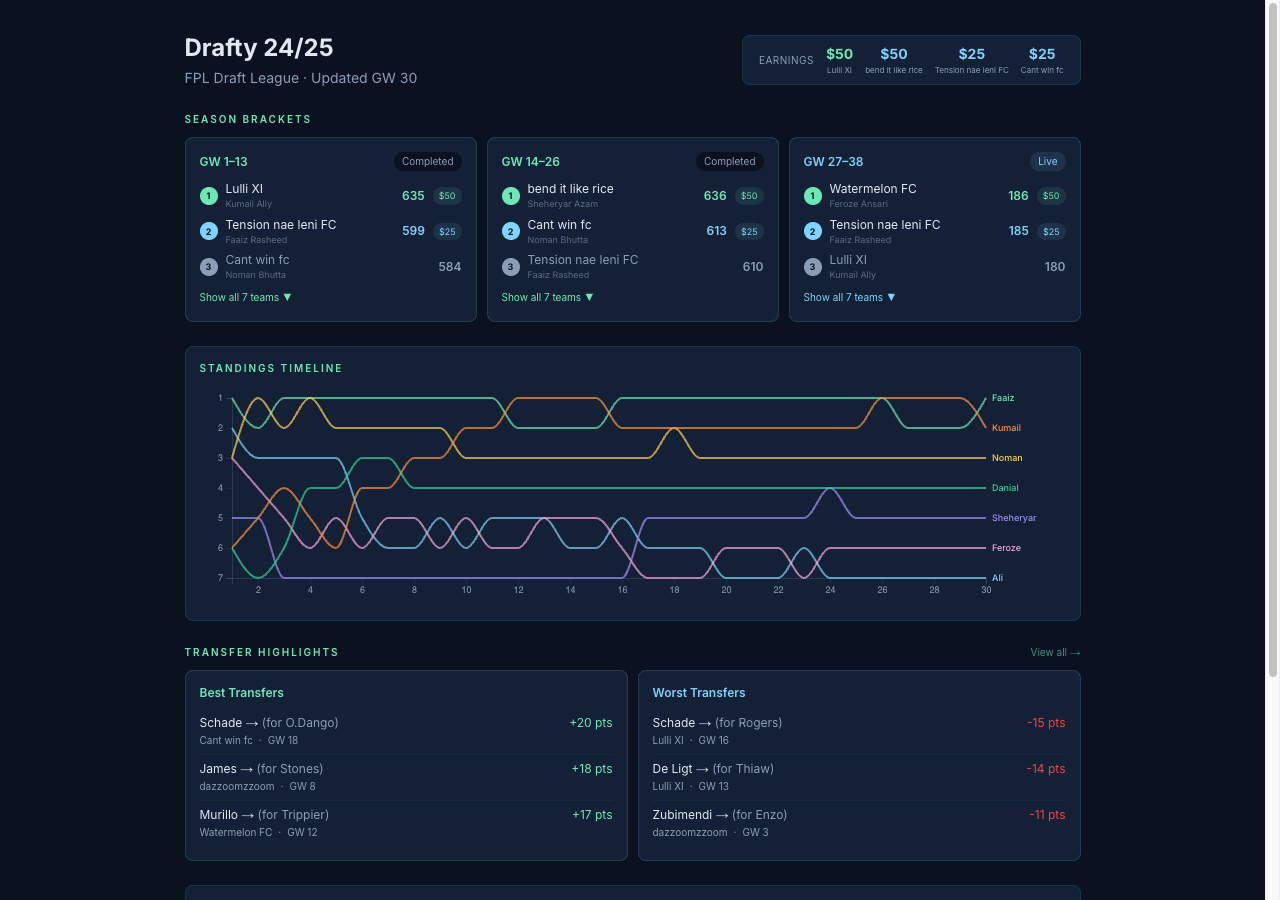
The main dashboard shows three bracket cards (the season is split into three scoring periods), a standings timeline tracking league position across all gameweeks, transfer highlights (best and worst), and a bench efficiency summary.
The standings timeline uses D3 line charts with team names overlaid directly on each line — no separate legend needed. Bracket cards are collapsible, showing the top 3 by default with an option to expand to all teams.
Transfer Analysis
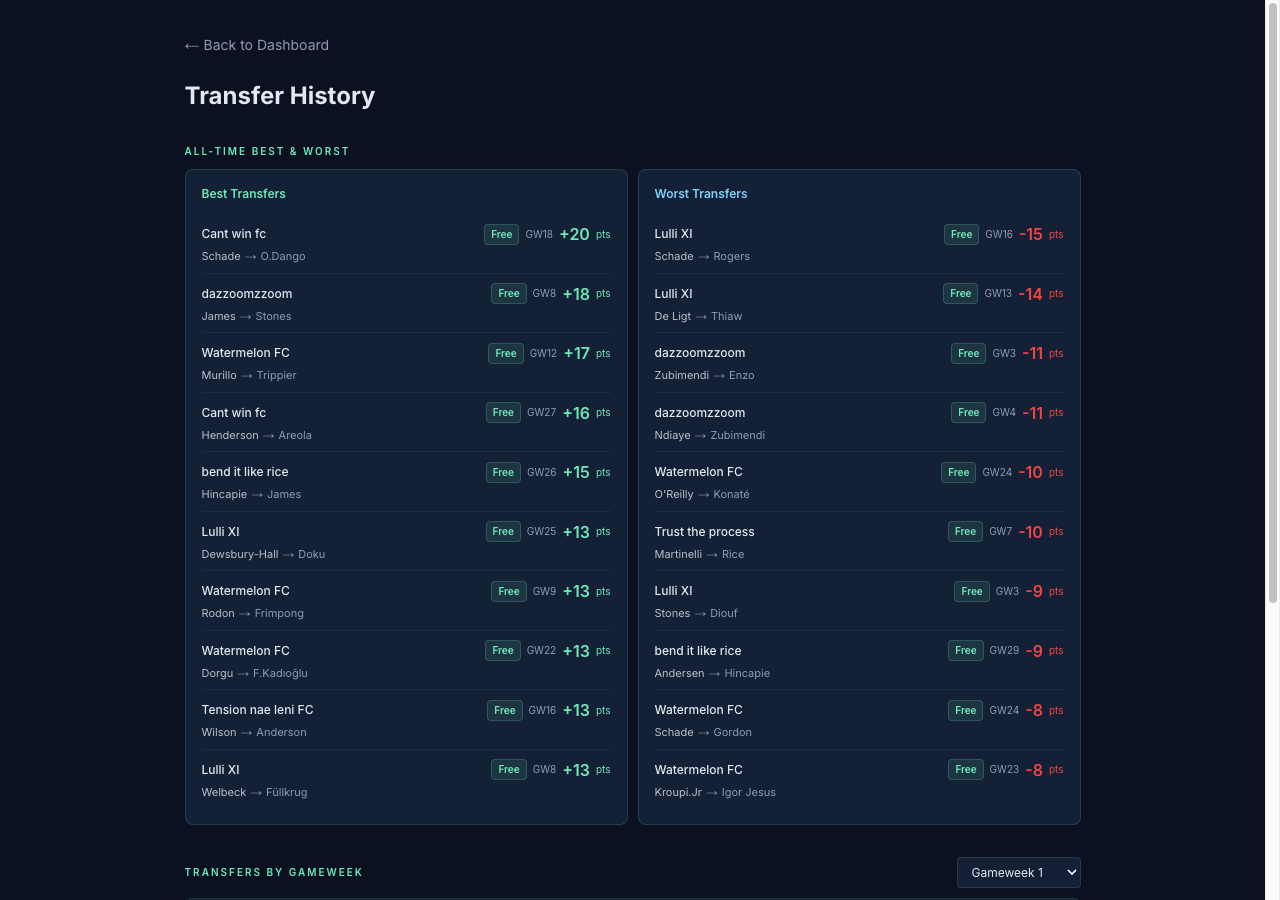
The transfers page shows all-time best and worst transfers ranked by net points gained or lost. A per-gameweek dropdown lets you drill into the specific transfers made each week — useful for post-gameweek banter about who picked up (or dropped) the wrong player.
Bench Efficiency
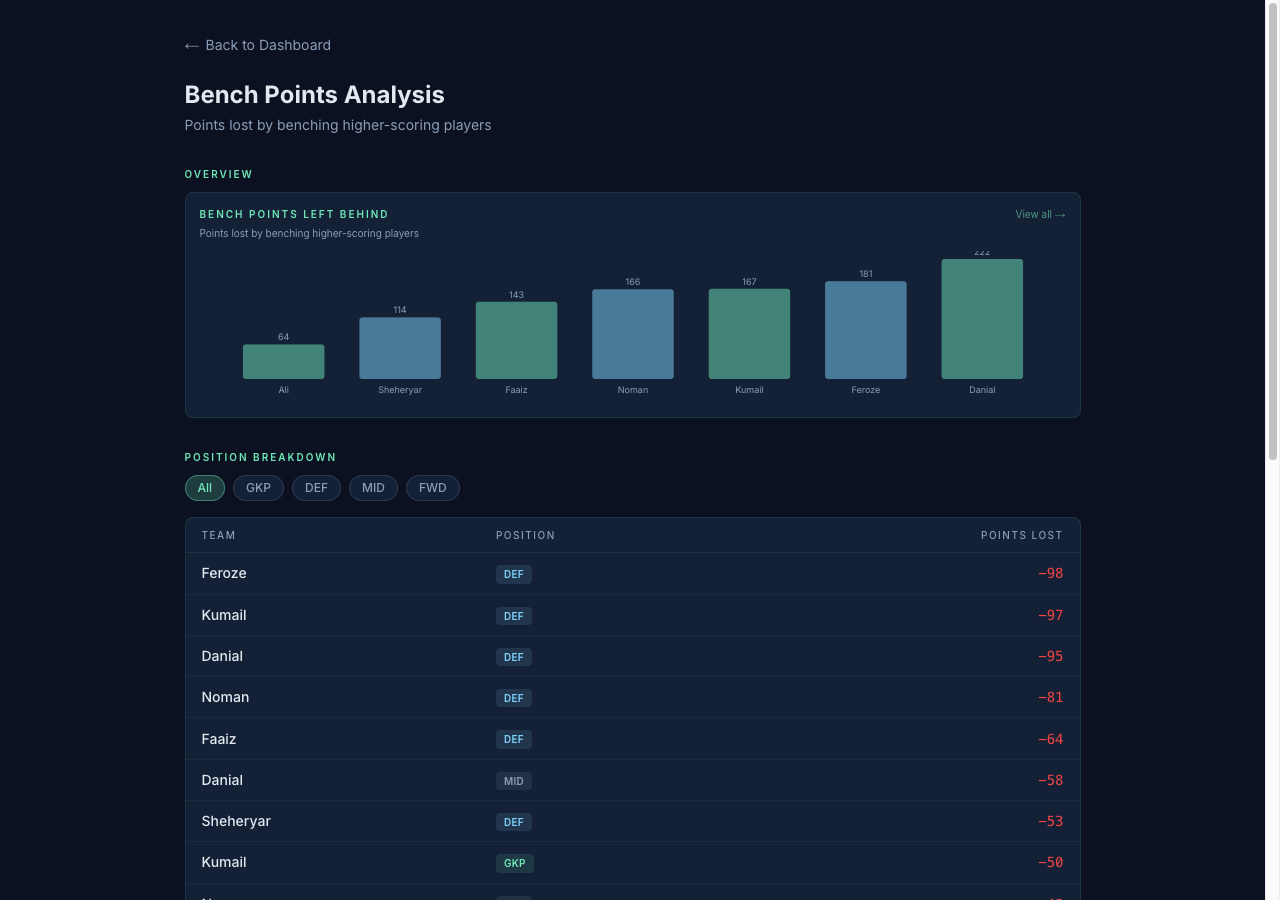
The bench analysis page quantifies points lost by benching higher-scoring players. A D3 bar chart shows total bench points per manager, while a position breakdown table lets you filter by GKP, DEF, MID, or FWD to see where each manager is leaving the most points on the bench.
Tech Stack
- Frontend: React 19, Next.js 16, D3.js 7, Tailwind CSS v4, TypeScript
- Pipeline: Python 3.11, DuckDB, Pandas, Loguru
- Deployment: Vercel (static export), GitHub Actions (weekly cron)